Address
9847 CAMPO RD
SPRING VALLEY CA 91977
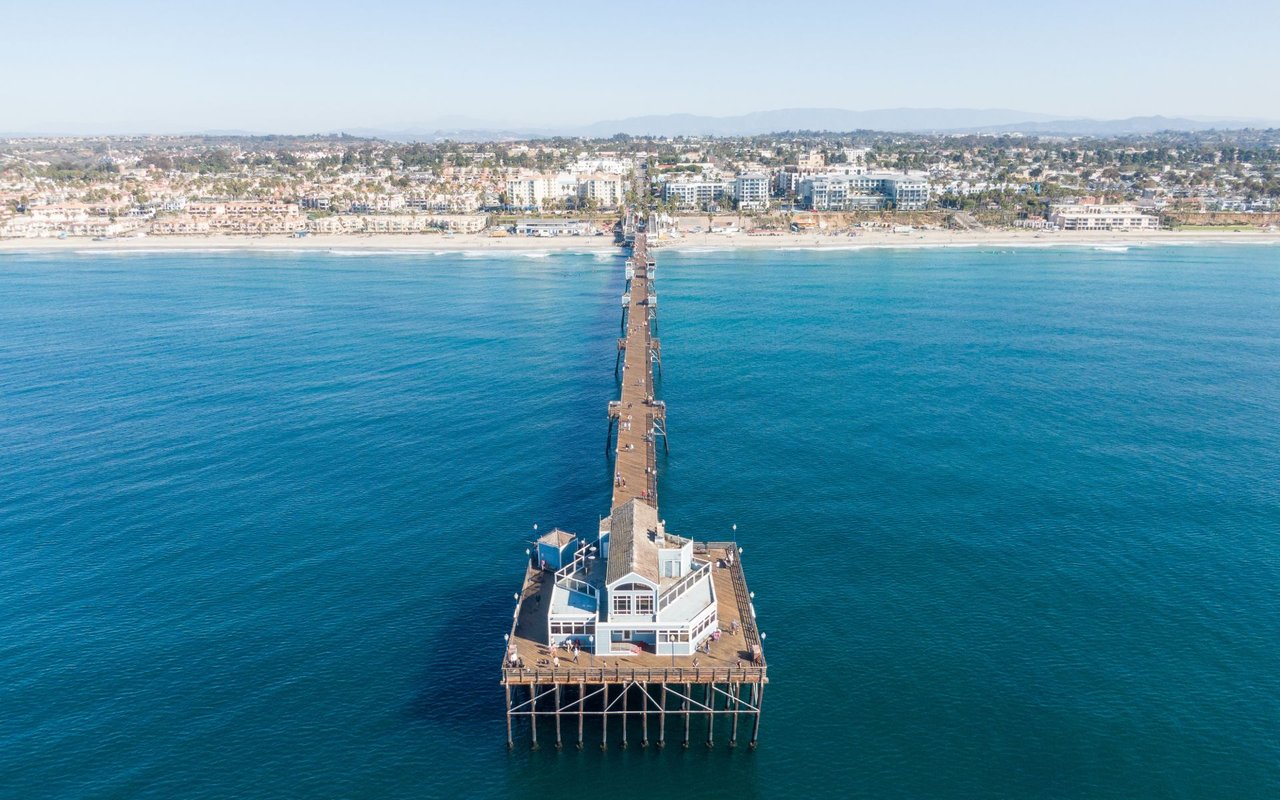
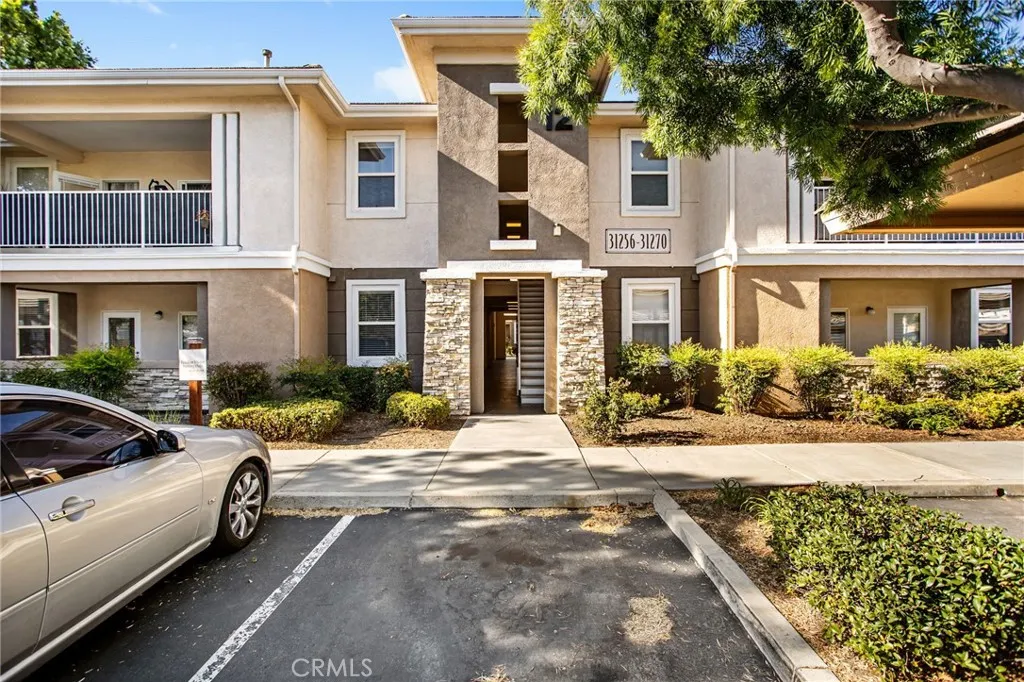
Welcome to
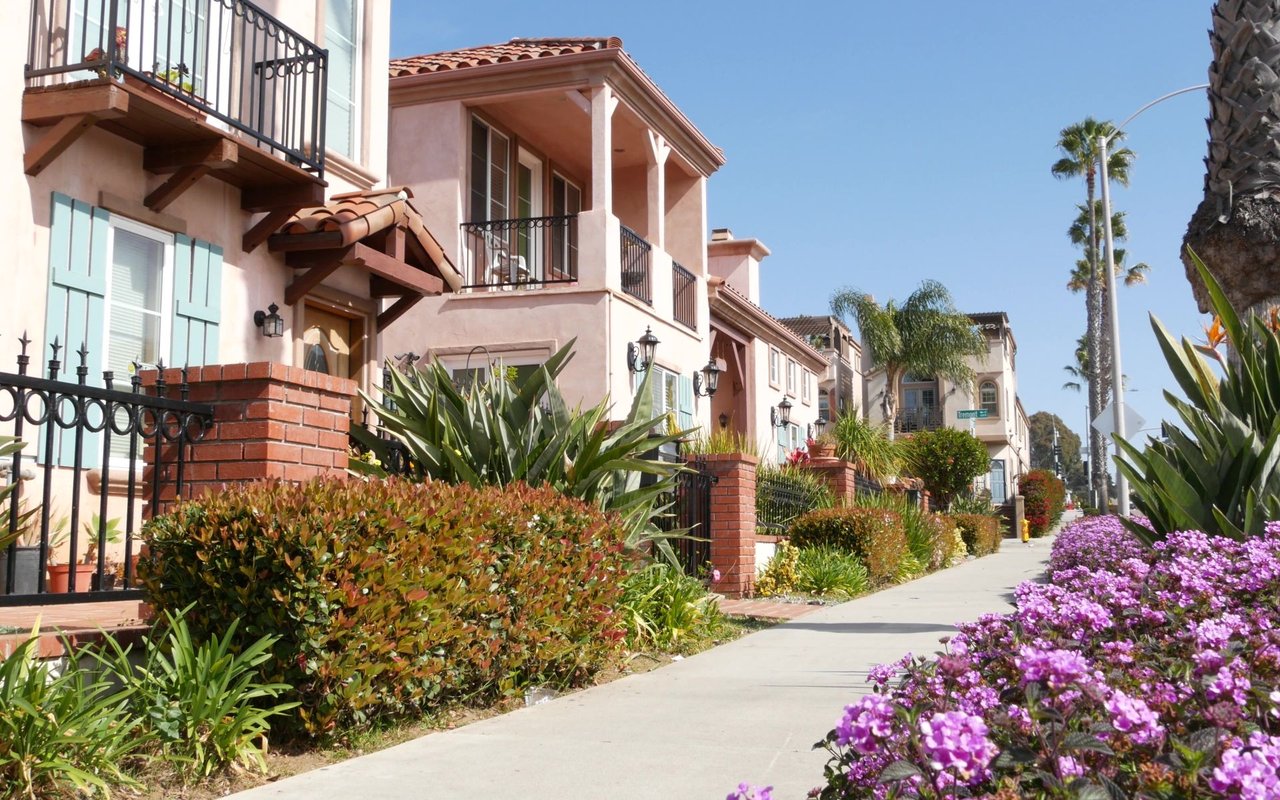
6,924 people live in South Oceanside, where the median age is 41 and the average individual income is $58,668. Data provided by the U.S. Census Bureau.
Total Population
Median Age
Population Density
Average individual Income
There's plenty to do around South Oceanside, including shopping, dining, nightlife, parks, and more. Data provided by Walk Score and Yelp.
Explore popular things to do in the area, including Il Caccia Caffe, Gym Rats, and CSG 360 Jiu Jitsu.
| Name | Category | Distance | Reviews |
Ratings by
Yelp
|
|---|---|---|---|---|
| Dining · $$ | 2.15 miles | 25 reviews | 5/5 stars | |
| Active | 4.7 miles | 7 reviews | 5/5 stars | |
| Active | 3.01 miles | 9 reviews | 5/5 stars | |
| Active | 4.72 miles | 25 reviews | 5/5 stars | |
| Beauty | 4.76 miles | 8 reviews | 5/5 stars | |
| Beauty | 1.98 miles | 7 reviews | 5/5 stars | |
| Beauty | 4.17 miles | 5 reviews | 5/5 stars | |
| Beauty | 1.3 miles | 9 reviews | 5/5 stars | |
| Beauty | 1.53 miles | 97 reviews | 5/5 stars | |
| Beauty | 0.4 miles | 9 reviews | 5/5 stars | |
| Beauty | 1.54 miles | 21 reviews | 5/5 stars | |
| Beauty | 1.22 miles | 9 reviews | 5/5 stars | |
| Beauty | 1.54 miles | 9 reviews | 5/5 stars | |
| Beauty | 1.2 miles | 10 reviews | 5/5 stars | |
|
|
||||
|
|
||||
|
|
||||
|
|
||||
|
|
||||
|
|
South Oceanside has 3,086 households, with an average household size of 2. Data provided by the U.S. Census Bureau. Here’s what the people living in South Oceanside do for work — and how long it takes them to get there. Data provided by the U.S. Census Bureau. 6,924 people call South Oceanside home. The population density is 7,201 and the largest age group is Data provided by the U.S. Census Bureau.
Total Population
Population Density Population Density This is the number of people per square mile in a neighborhood.
Median Age
Men vs Women
Population by Age Group
0-9 Years
10-17 Years
18-24 Years
25-64 Years
65-74 Years
75+ Years
Education Level
Total Households
Average Household Size
Average individual Income
Households with Children
With Children:
Without Children:
Blue vs White Collar Workers
Blue Collar:
White Collar: